Last updated on October 8th, 2023 at 02:52 pm

This article on flowchart algorithms is meant to be an introduction to flowcharts as part of the problem-solving process. We prepared it to help you to learn more about:
- What a flowchart is;
- The symbols used in a flowchart when problem-solving; and
- How to prepare a flowchart to suit CSEC standards;
Algorithms are usually used in information technology and computer science to prepare the step-by-step instructions used to solve a problem. They are part of the problem-solving process. There are several types of algorithms. CSEC typically focuses on two, the flow chart and the pseudocode. To learn more about what an algorithm is and how to prepare a pseudocode, visit what is an algorithm and learn how to prepare one.
So what exactly is a flowchart in problem-solving?
A flowchart, sometimes referred to as a flow diagram, is an algorithm diagram that uses special symbols to indicate the types of processes being executed. It uses diagrams to show the step-by-step solution to a problem. A flowchart uses arrows to indicate the order of the steps.
Computers have other problems that are not solved by writing programs. To explore this further, be sure to check out troubleshooting common desktop monitor problems or troubleshooting computer battery issues.
Symbols used in a flowchart algorithm

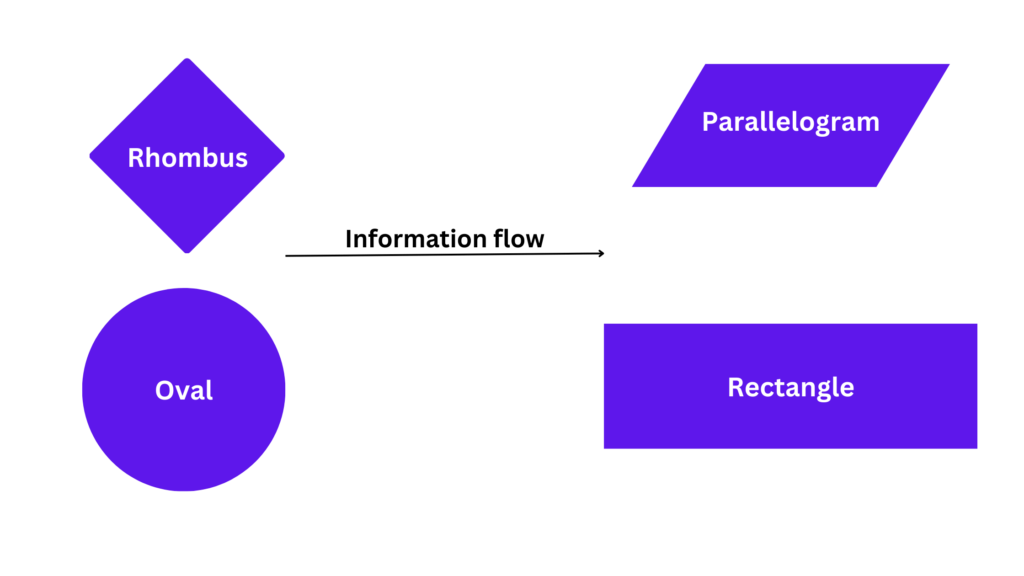
The following symbols are used in the flowchart algorithm:
- The Oval: The oval is always the first and last items in a flowchart. It is used to indicate the points where the solution starts and stops.
- The parallelogram indicates input and output;
- The rectangle indicates a process or assignment;
- A diamond or rhombus is used to indicate a decision or condition; and
- The arrow symbol shows the directional flow, that is, what instruction is to be executed next.
Example of the flowchart algorithm
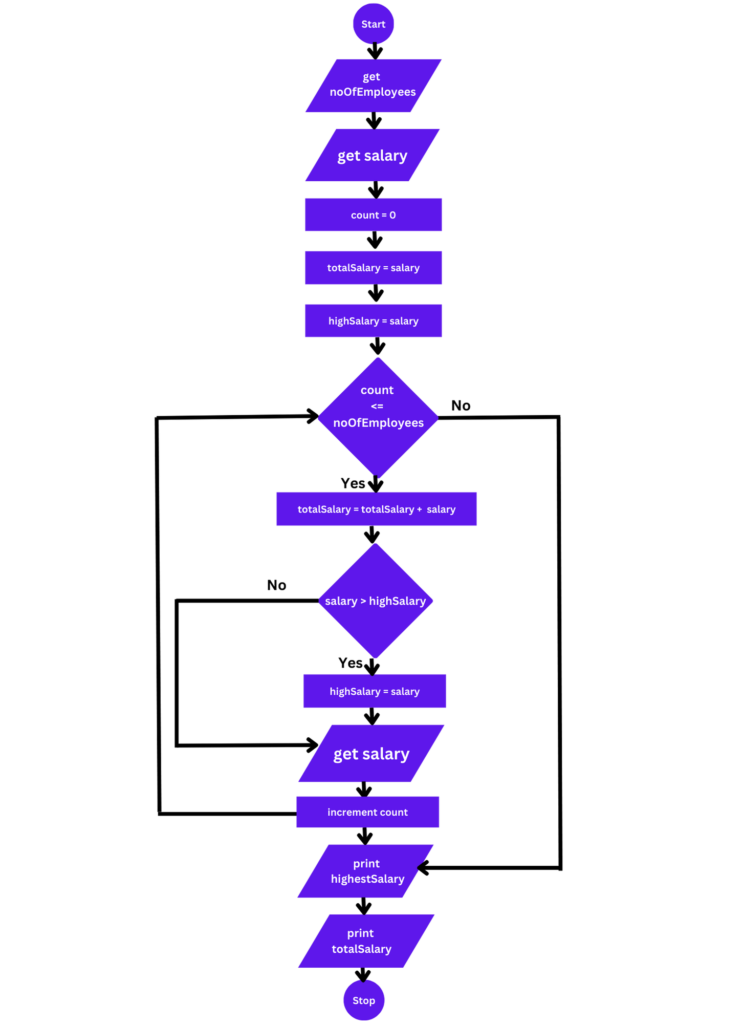
Imagine if you were asked to create a program that would accept the salary of 5 employees, calculate the total amount of money paid out in salaries, and find and print the name and dollar amount for the highest-paid employee. To make your job easier, let’s look at the problem-defining diagram first. The input and output sections in the table show the variables that are being entered and printed.
Want to learn more about input and output? Visit our article on variables vs. consonants.
| Input | Process | Output |
|---|---|---|
| salary | 1. Get the numberOfEmployees. | totalSalary |
| numberOfEmployees | 2. Get salary. | highestSalary |
| 3. Calculate the totalSalary. | ||
| 4. Find the highestSalary. | ||
| 5. Print the totalSalary. | ||
| 6. Print the highestSalary. | ||
The diagram below is a flowchart algorithm of the problem defining diagram shown above.

Once you have prepared your algorithm, you will need to test it for correctness. For this, we use a trace table. If you are interested in learning more about trace tables, visit our article on what a trace table is. Tracetables are used to test algorithms for correctness.
If you are interested in learning how to prepare a program using the problem-defining diagram, algorithm, trace table, and finally finish with an actual Pascal program, we have a series of lessons for you. You may begin by visiting lesson 1 – What is Pascal? You should also check out our lesson on Pascal variables.
Before you go
We do our best to be thorough in the information we provide. However, if you have any questions or comments, please leave them in the comment section below.
 Skip to content